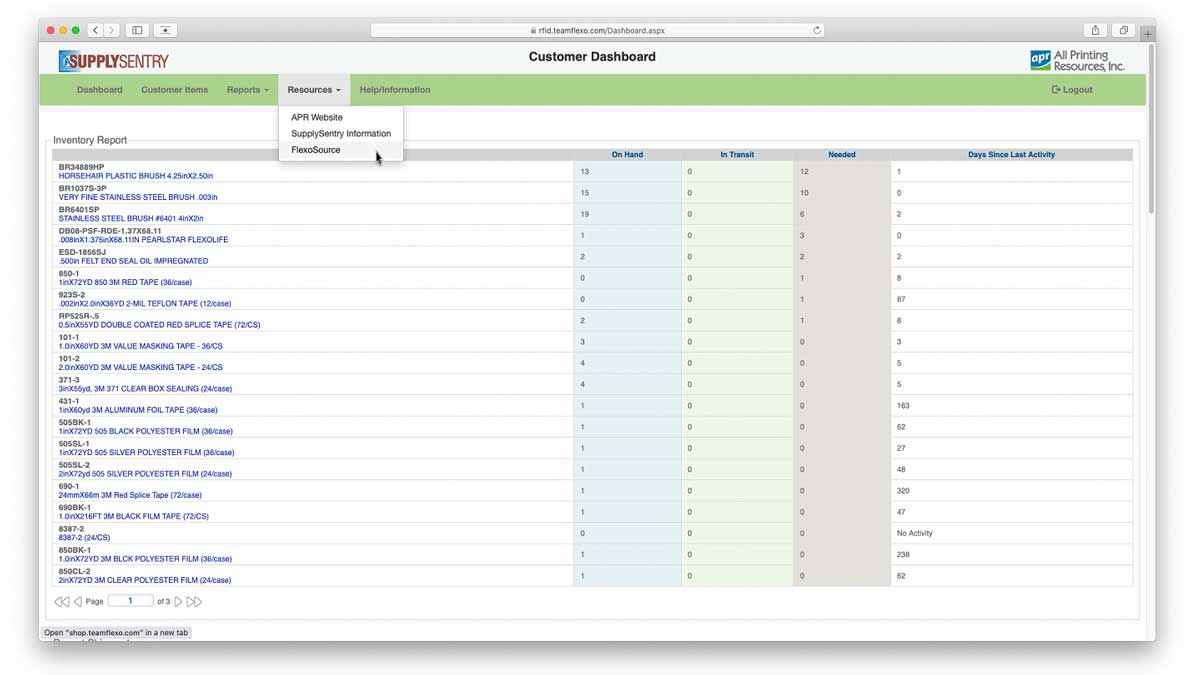
The SupplySentry Customer Dashboard contains a wealth of information about the customer’s supply inventory. From this website, the customer can see what they have currently in stock, as well as what items are in transit.
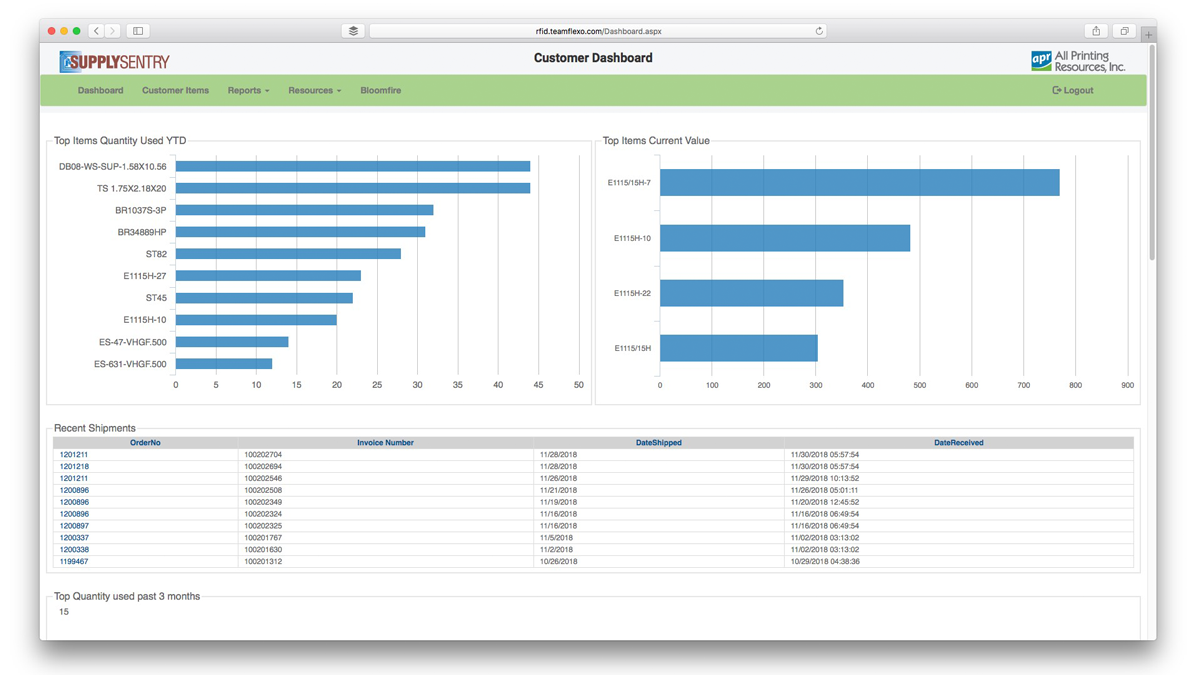
The Customer Dashboard
Data displayed on the Customer Dashboard includes:
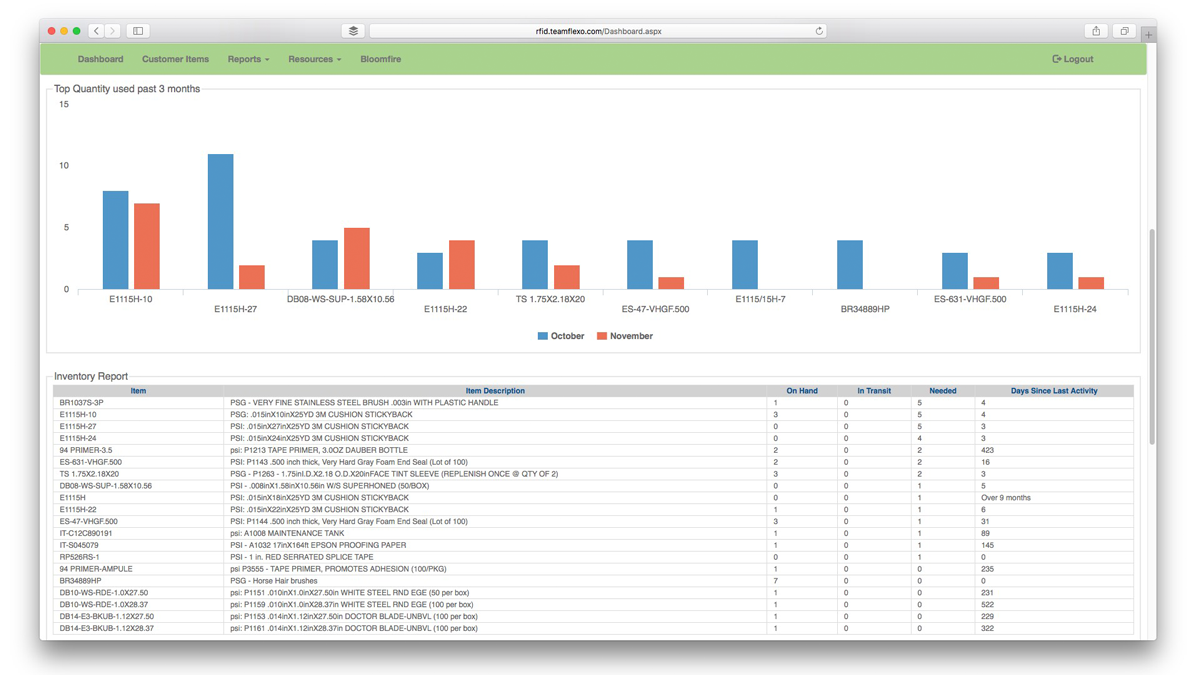
- Inventory Report - Shows quantities of items currently on hand, any items in transit, and the number of days since last activity
- Recent Shipments - Shows the last 10 shipments with the Order Number, Invoice number, Date Shipped and Date Received. By clicking on the Order Number, the customer can see the items and quantities on that order.
- Top Items Quantity Used YTD - This bar chart shows the items with the highest usage year-to-date. Roll over any bar to display item description and quantities.
- Top Items Current Value - This bar chart compares the dollar values of items currently on hand. Roll over any bar to see a description of the item along with quantity and dollar value for that item.
- Top Quantity used past 3 months - This bar chart shows three months usage data for each item in stock. Roll over any of the bars for description and quantities.
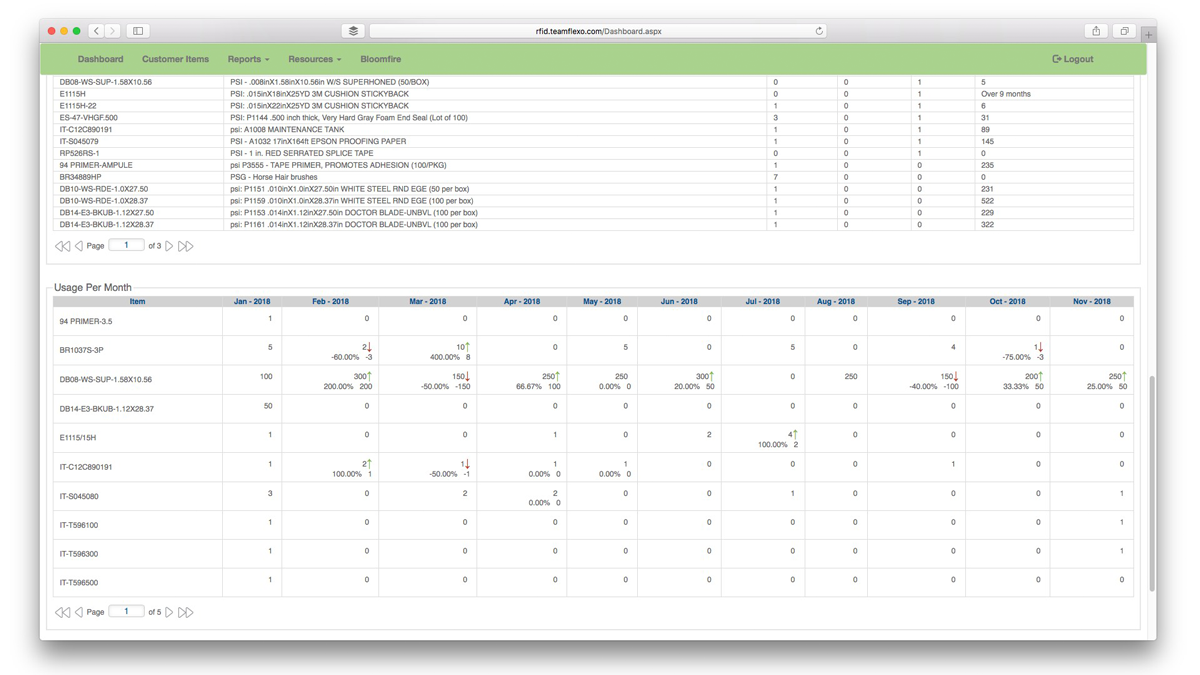
- Usage Per Month - This table displays the monthly usage of each item for the past 10 months with percentage of change from the previous month.
Customer Items
Another page on this website is called Customer Items. This view allows the user to see all of the items that they have in stock with the quantities for: on hand, on order, and in transit. Values for minimum quantity, maximum quantity and re-order point can also be adjusted on this page. The final column on this table shows the suggested re-order quantity for the amount currently on hand.

Reports
Tools for running reports about your supplies are also available on this website. These reports can be helpful when trying to determine any issues with your inventory or the system. The available reports are:
- Inventory - This form allows you to set variables to look at the status of your current inventory. You can select to view the inventory from any of your locations, from any storage area, and by item. The selected data is displayed in a table on the page that shows the item number, the location, the description, the RFID tag numbers, the order number for each item, its status, and the date that the RFID tag for that item was created.
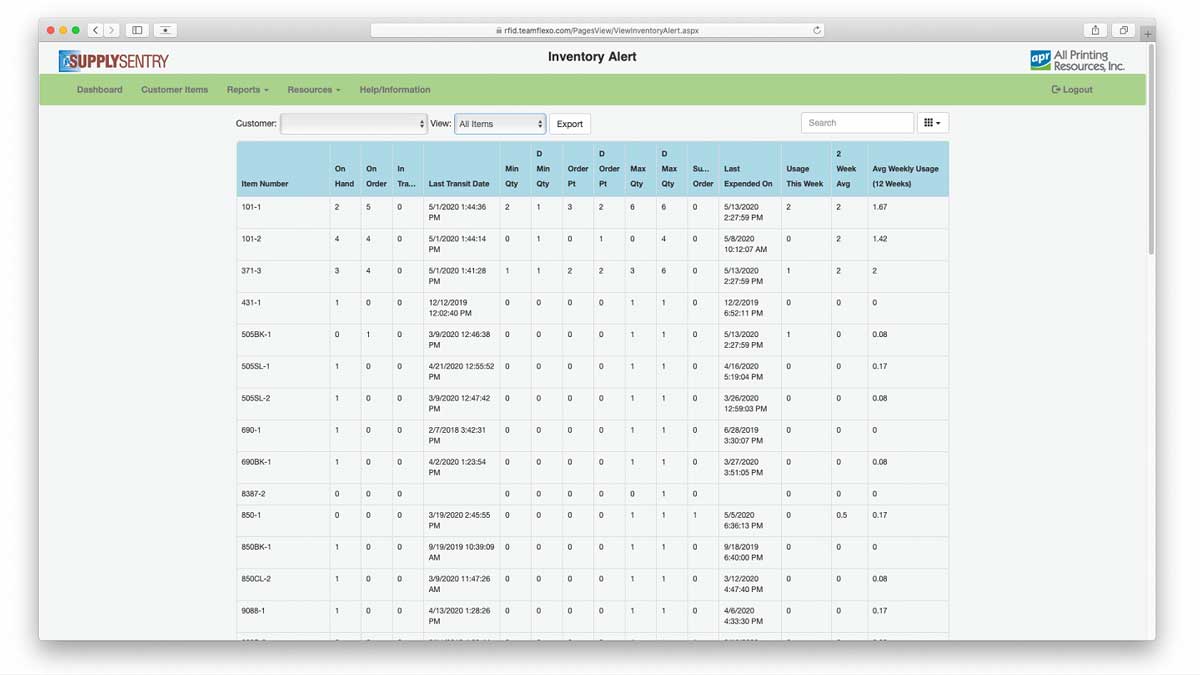
- Inventory Alert - This form works similarly to the Inventory report, but shows slightly different data with things like usage this week, and average weekly use. There is also a filter to show only the items that are currently at a quantity that is at, or lower than, the re-order point.
- Replenishment - This report collects the information that one can use to check the amounts needed to replenish each of the items in the inventory and generates an Excel spreadsheet that is downloaded to the user's computer.
- Inventory Summary - This report collects just the item number, location, description and quantity on hand and is presented as an Excel document that is automatically downloaded to the user's computer.
- Inventory on Hand - This report is similar ro the inventory summary, but it also contains the quantities on order and in transit for each item. This report is presented as an Excel document that is automatically downloaded to the user's computer.
- Usage - This report allows the user to set a date range and see the usage for each item during that timeframe. The data is presented as an Excel document that is automatically downloaded to the user's computer.
- Aging History - This report allows the user to select a date in the past, and it will show all of the items in the inventory that are older than that date. It also shows the current quantity on hand for each item. This report is presented as an Excel document that is automatically downloaded to the user's computer.
- Tag History - This report allows the user to set a date range to look at RFID tag activity. The report shows what tags were read during the time period selected and their status. This report is presented as an Excel document that is automatically downloaded to the user's computer.
- Last Tags Read - This report gathers a list of all of the RFID tags that were read on the last cycle of the system. It shows the Date and Time, the RFID tag number, the location(s) where the tag was read, the item number and the description of all the items read in the most recent cycle. This report is presented as an Excel document that is automatically downloaded to the user's computer.
Resources
Another menu on this site lists "Resources" available from APR. There are links to APR's main website, The SupplySentry website, and FlexoSource - APR's e-commerce web store.
Help/Information
The final link on the navigation bar is a link titled "Help/Information". This link will take you to the SupplySentry Product Data Portal.